 geo.be Metadata Catalog
federal government
Type of resources
Available actions
Topics
INSPIRE themes
federalThemes
Keywords
Contact for the resource
Provided by
Years
Formats
Representation types
Update frequencies
status
Service types
Scale
Resolution
-

This AtomFeed download service provides access to federal datasets that are not reported under the INSPIRE Directive. The datasets can be accessible for free or under conditions.
-
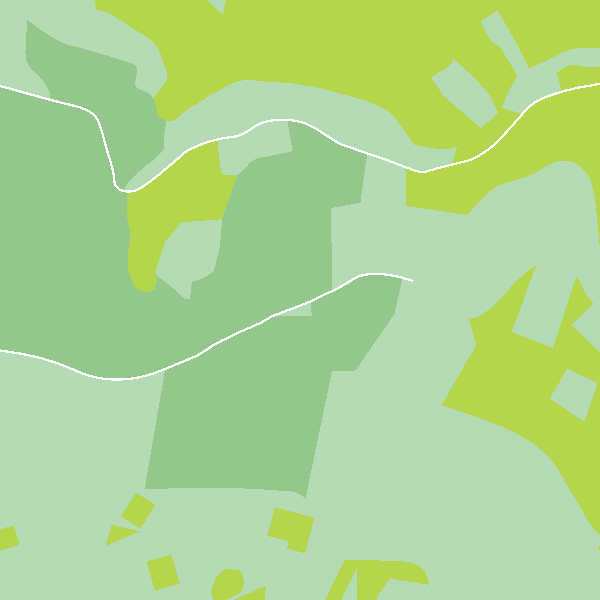
Top10Vector – Land cover and vegetation is the vector data set of the land use of unbuilt land areas in Belgium. This data set includes three classes. First class: dry and unbuilt areas or areas not used as roads. Second class: hedges. Third class: linear vegetation. This data set can be bought via the corresponding hyperlink.
-
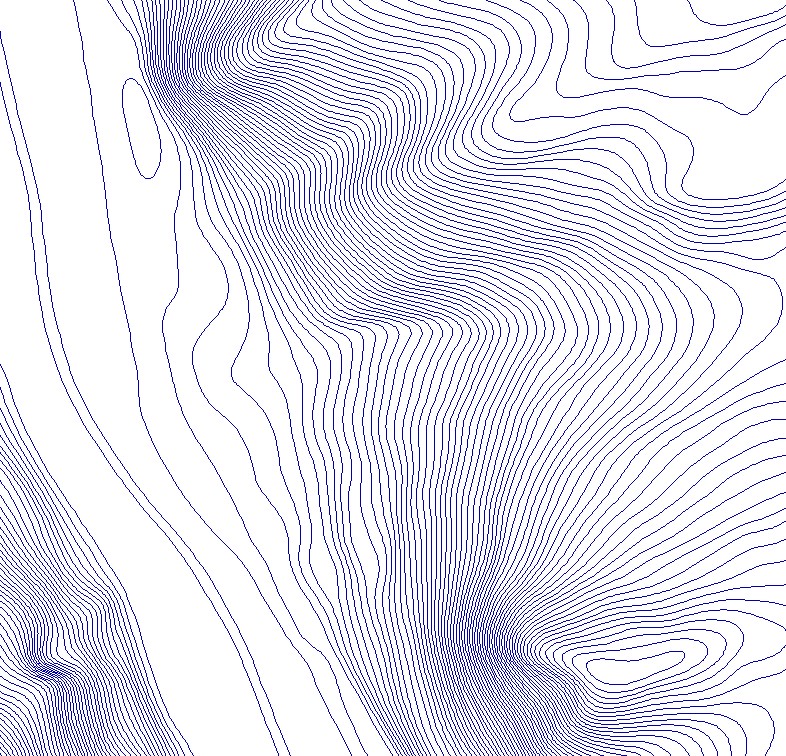
The contour lines are the set of lines connecting all points at the same elevation in a model used to represent the relief on a large scale.
-
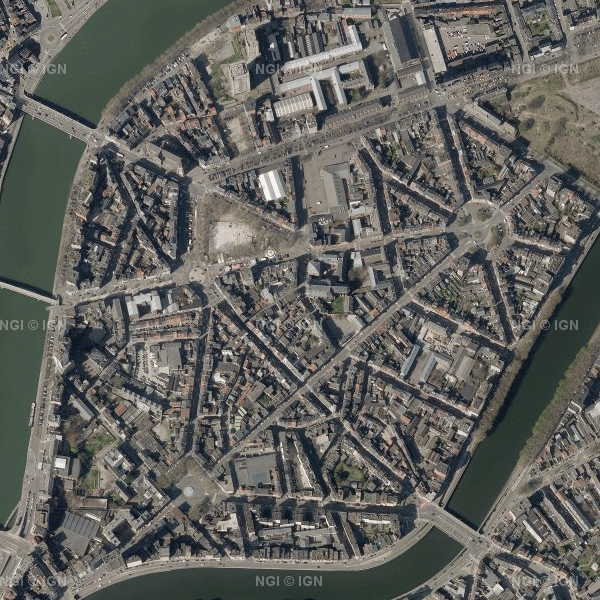
Orthophotos are digital aerial photographs that have been adjusted for lens distortion, topographic relief and camera tilt. This cover is renewed every three years.The orthophotographs have a minimal resolution of 50 cm. The dataset is generated from the harmonisation of the datasets owned by the Belgian administrative regions.The dataset is INSPIRE compliant. The dataset is downloadable per NGI mapsheet at scale 1:50000.
-
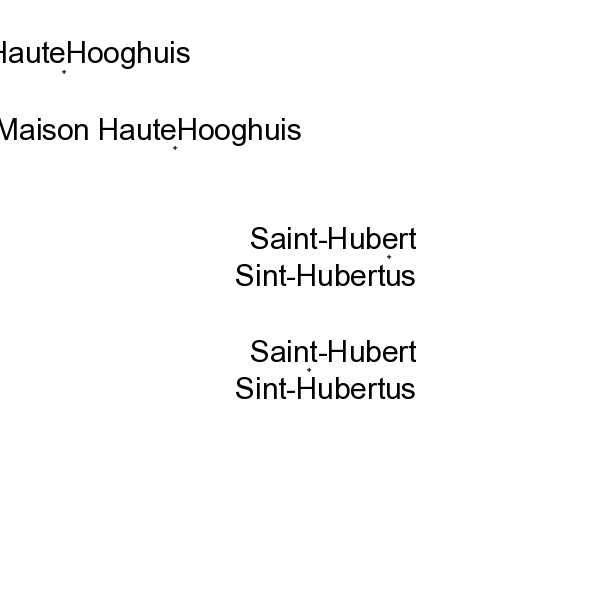
The layer Geographical Names includes all the names of administrative units, uninhabited places, waterways, remarkable buildings and infrastructures. They are classified into different feature and attribute classes.
-
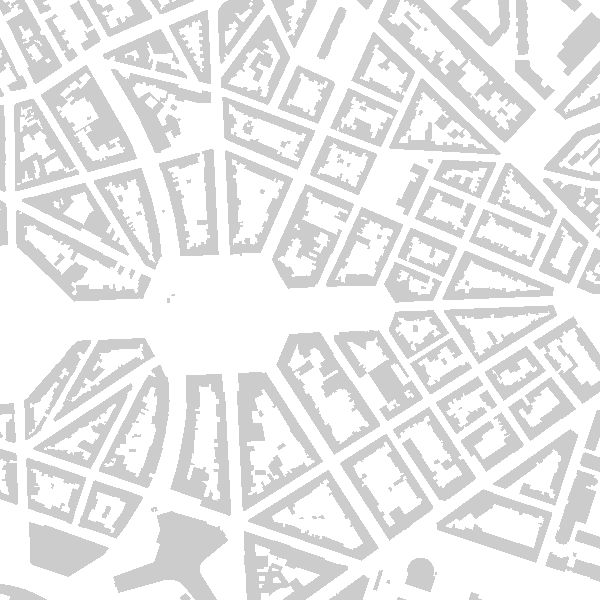
Buildings is the INSPIRE 2D vector data set of the "Constructions" layer originated from the Top10vector product of the National Geographic Institute in Belgium . It includes the "Building" features and the "OtherConstruction" features in accordance with the INSPIRE specifications.
-
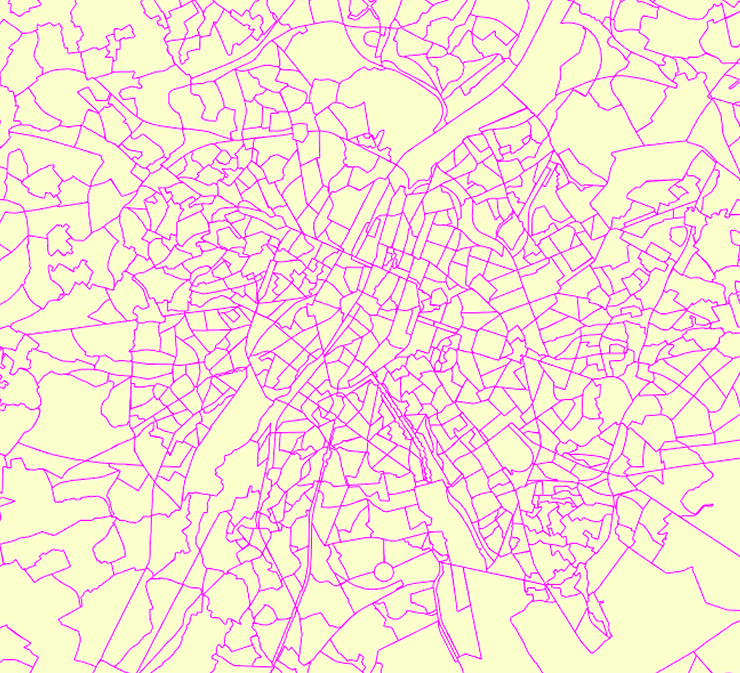
The data set has been established according to the INSPIRE format. It presents in the form of polygons the breakdown of Belgium in almost 20,000 statistical sectors. The statistical sector is the basic territorial unit resulting from the subdivision of the territory of municipalities by STATBEL since 1970 for the dissemination of its statistics at a finer level than the municipal level. A statistical sector cannot extend over two municipalities and any point in the municipal territory is part of one and the same statistical sector. The 1970 and 1981 versions are shown in analogue format while the 2001, 2011, 2018 and 2019 versions are available in digital vector format. The files can be linked to the data on population, housing and disposable income on the website of Statbel.
-
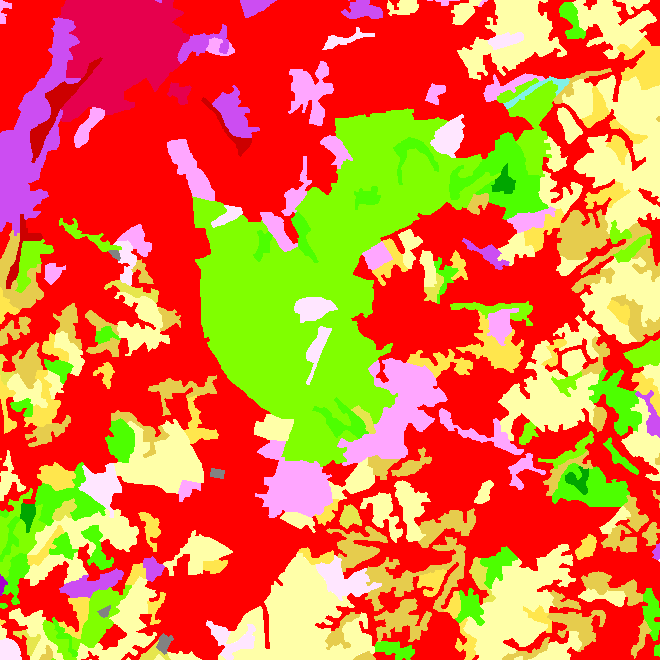
The data set contains a seamless polygonal layer representing the land cover in Belgium for the year 2018. The dataset is INSPIRE compliant.
-
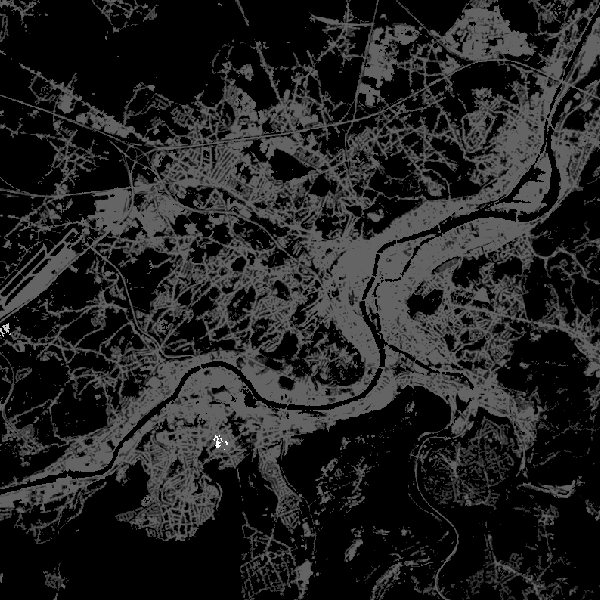
The product is made of 6 "high resolution layers" covering all the Belgian territory as part of a European-wide coverage. The 6 layers concern 6 distinct themes: Imperviousness, Tree cover density, Forest type, Permanent grasslands, Wetlands and Permanent waterbodies. The 6 layers were produced by an automatic classification based on satellite images and collateral data and achieved by private companies (EEA service providers), and they were verified and enhanced by Belgium. At the Belgian level, verification and enhancements were made by AGIV for the northern part and SPW for the southern part. The NGI coordinated the project.
-
The data set includes three types of breakdown: Cities, Larger Urban zones or Functional Urban areas. BE_StatisticsBelgium_SH_SU_UA_CITY presents in the form of polygons the borders of the Belgian cities participating to the Urban Audit of the European Commission. Some cities consist in only one municipality (LAU2) while the others are the result of the aggregation of several municipalities (LAU2). Several versions of the breakdown (2001, 2002, 2010, 2019) follow one another because over the years new cities have taken part in it. The files can be linked to the statistical data collected for the Urban Audit. BE_StatisticsBelgium_SH_SU_UA_LUZ and BE_StatisticsBelgium_SH_SU_UA_FUA present in the form of polygons the areas of influence of the Urban Audit cities on the surrounding municipalities. The initial concept of Larger Urban Zones (LUZ) was replaced by the concept of Functional Urban areas (FUA) to take into account the movement of workers to the Urban Audit cities. LUZ / FUA are an aggregation of municipalities (LAU2). Several versions of the breakdown (2001, 2002, 2010, 2019) follow one another because over the years new LUZ / FUA have appeared or have seen their extension modified. The files can be linked to the statistical data collected for the Urban Audit.